achfrag.net/2025/07/05/postgresql-flamegraph.html
Preview meta tags from the achfrag.net website.
Linked Hostnames
14- 12 links toachfrag.net
- 3 links togithub.com
- 2 links towww.brendangregg.com
- 2 links towww.linkedin.com
- 1 link tobugs.debian.org
- 1 link todl.acm.org
- 1 link tojnidzwetzki.github.io
- 1 link toperfwiki.github.io
Thumbnail
Search Engine Appearance
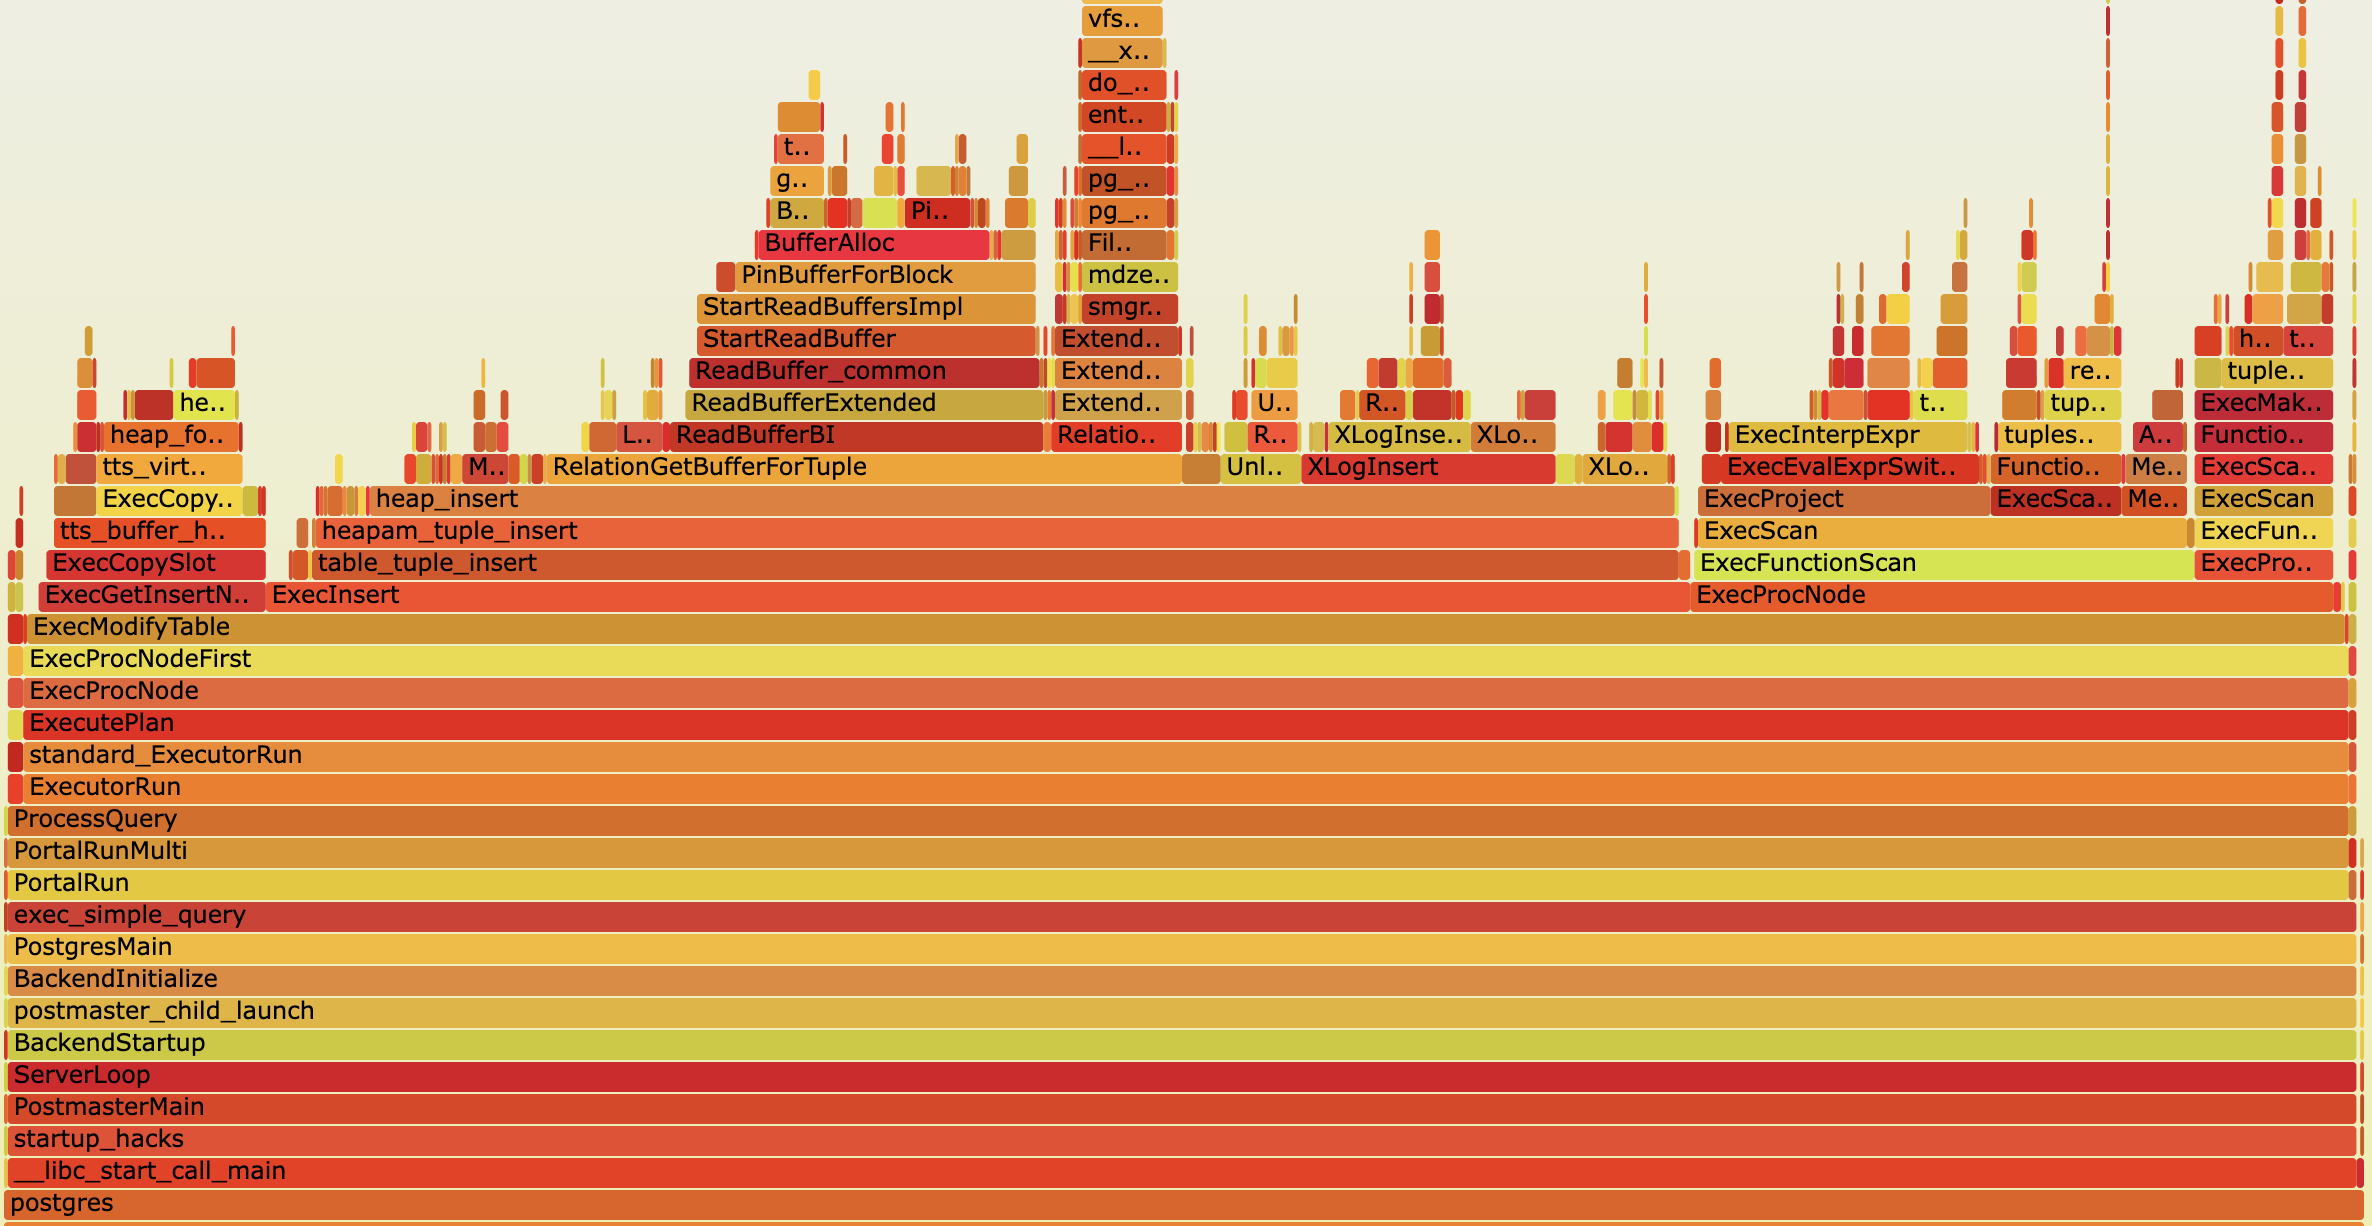
Analyzing PostgreSQL Performance Using Flame Graphs
A flame graph is a graphical representation that helps to quickly understand where a program spends most of its processing time. These graphs are based on sampled information collected by a profiler while the observed software is running. At regular intervals, the profiler captures and stores the current call stack. A flame graph is then generated from this data to provide a visual representation of the functions in which the software spends most of its processing time. This is useful for understanding the characteristics of a program and for improving its performance. This blog post explores the fundamentals of flame graphs and offers a few practical tips on utilizing them to identify and debug performance bottlenecks in PostgreSQL.
Bing
Analyzing PostgreSQL Performance Using Flame Graphs
A flame graph is a graphical representation that helps to quickly understand where a program spends most of its processing time. These graphs are based on sampled information collected by a profiler while the observed software is running. At regular intervals, the profiler captures and stores the current call stack. A flame graph is then generated from this data to provide a visual representation of the functions in which the software spends most of its processing time. This is useful for understanding the characteristics of a program and for improving its performance. This blog post explores the fundamentals of flame graphs and offers a few practical tips on utilizing them to identify and debug performance bottlenecks in PostgreSQL.
DuckDuckGo
Analyzing PostgreSQL Performance Using Flame Graphs
A flame graph is a graphical representation that helps to quickly understand where a program spends most of its processing time. These graphs are based on sampled information collected by a profiler while the observed software is running. At regular intervals, the profiler captures and stores the current call stack. A flame graph is then generated from this data to provide a visual representation of the functions in which the software spends most of its processing time. This is useful for understanding the characteristics of a program and for improving its performance. This blog post explores the fundamentals of flame graphs and offers a few practical tips on utilizing them to identify and debug performance bottlenecks in PostgreSQL.
General Meta Tags
9- titleAnalyzing PostgreSQL Performance Using Flame Graphs | Jan’s website and blog
- charsetutf-8
- viewportwidth=device-width, initial-scale=1, minimum-scale=0.5, maximum-scale=5
- generatorJekyll v3.10.0
- authorJan Nidzwetzki
Open Graph Meta Tags
8- og:imagehttps://jnidzwetzki.github.io/assets/img/flamegraph2.png
- og:typewebsite
- og:titleAnalyzing PostgreSQL Performance Using Flame Graphs
 og:localeen_US
- og:descriptionA flame graph is a graphical representation that helps to quickly understand where a program spends most of its processing time. These graphs are based on sampled information collected by a profiler while the observed software is running. At regular intervals, the profiler captures and stores the current call stack. A flame graph is then generated from this data to provide a visual representation of the functions in which the software spends most of its processing time. This is useful for understanding the characteristics of a program and for improving its performance. This blog post explores the fundamentals of flame graphs and offers a few practical tips on utilizing them to identify and debug performance bottlenecks in PostgreSQL.
Twitter Meta Tags
6- twitter:cardsummary
- twitter:titleAnalyzing PostgreSQL Performance Using Flame Graphs
- twitter:descriptionA flame graph is a graphical representation that helps to quickly understand where a program spends most of its processing time. These graphs are based on sa...
- twitter:cardsummary
- twitter:imagehttps://jnidzwetzki.github.io/assets/img/flamegraph2.png
Link Tags
5- alternatehttps://jnidzwetzki.github.io/feed.xml
- alternatehttps://jnidzwetzki.github.io/feed.xml
- canonicalhttps://jnidzwetzki.github.io/2025/07/05/postgresql-flamegraph.html
- shortcut icon/assets/favicon.ico
- stylesheet/assets/css/main.css
Emails
1Links
29- https://achfrag.net
- https://achfrag.net/2025/06/03/art-of-query-optimization.html
- https://achfrag.net/about
- https://achfrag.net/assets/misc/flamegraph/flamegraph.html
- https://achfrag.net/assets/misc/flamegraph/flamegraph.svg