decarbonization.visualcapitalist.com/age-of-energy-projects-in-interconnection-queues-by-state
Preview meta tags from the decarbonization.visualcapitalist.com website.
Linked Hostnames
19- 33 links todecarbonization.visualcapitalist.com
- 5 links towww.motive-power.com
- 4 links towww.facebook.com
- 4 links towww.linkedin.com
- 3 links totwitter.com
- 3 links towww.reddit.com
- 2 links towww.energy.gov
- 1 link toadvisor.visualcapitalist.com
Thumbnail
Search Engine Appearance
https://decarbonization.visualcapitalist.com/age-of-energy-projects-in-interconnection-queues-by-state
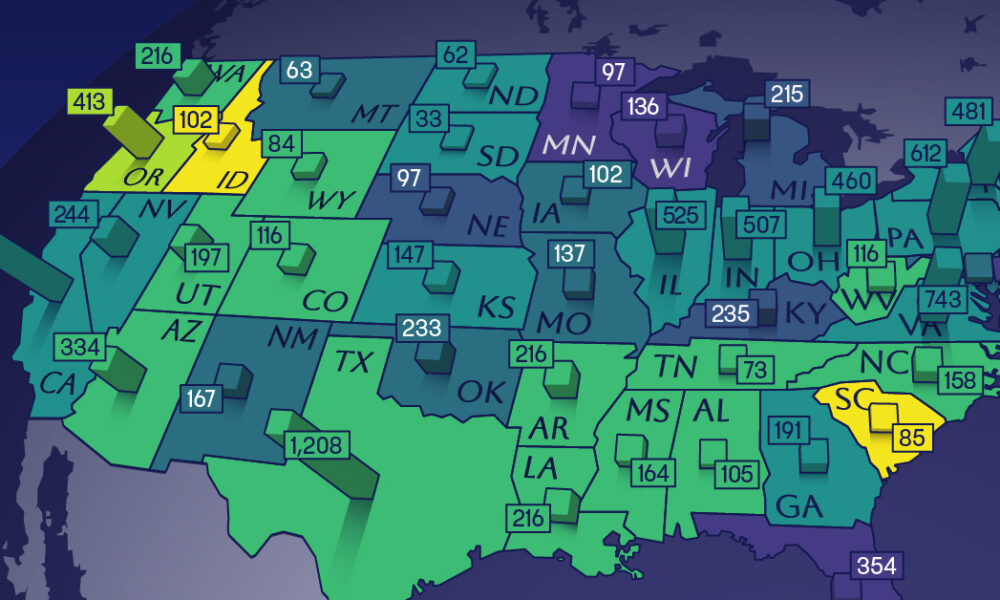
Mapped: The Age of Energy Projects in Interconnection Queues, by State
This map shows how many energy projects are in interconnection queues by state and how long these projects have been queued up, on average.
Bing
Mapped: The Age of Energy Projects in Interconnection Queues, by State
https://decarbonization.visualcapitalist.com/age-of-energy-projects-in-interconnection-queues-by-state
This map shows how many energy projects are in interconnection queues by state and how long these projects have been queued up, on average.
DuckDuckGo
Mapped: The Age of Energy Projects in Interconnection Queues, by State
This map shows how many energy projects are in interconnection queues by state and how long these projects have been queued up, on average.
General Meta Tags
12- titleThe Age of Energy Projects in Interconnection Queues, by State
- charsetUTF-8
- viewportwidth=device-width
- robotsindex, follow, max-image-preview:large, max-snippet:-1, max-video-preview:-1
- dlm-version5.0.9
Open Graph Meta Tags
11- og:typearticle
- og:urlhttps://decarbonization.visualcapitalist.com/age-of-energy-projects-in-interconnection-queues-by-state/
- og:titleMapped: The Age of Energy Projects in Interconnection Queues, by State
- og:descriptionThis map shows how many energy projects are in interconnection queues by state and how long these projects have been queued up, on average.
- og:descriptionThis map shows how many energy projects are in interconnection queues by state and how long these projects have been queued up, on average.
Twitter Meta Tags
13- twitter:imagehttps://decarbonization.visualcapitalist.com/wp-content/uploads/2024/04/shareable-1000x600.jpg
- twitter:cardsummary
- twitter:urlhttps://decarbonization.visualcapitalist.com/age-of-energy-projects-in-interconnection-queues-by-state/
- twitter:titleMapped: The Age of Energy Projects in Interconnection Queues, by State
- twitter:descriptionThis map shows how many energy projects are in interconnection queues by state and how long these projects have been queued up, on average.
Item Prop Meta Tags
2- mainEntityOfPage
- dateModified2024-04-29
Link Tags
40- EditURIhttps://decarbonization.visualcapitalist.com/xmlrpc.php?rsd
- alternatehttps://decarbonization.visualcapitalist.com/feed/
- alternatehttps://decarbonization.visualcapitalist.com/comments/feed/
- alternatehttps://decarbonization.visualcapitalist.com/age-of-energy-projects-in-interconnection-queues-by-state/feed/
- alternatehttps://decarbonization.visualcapitalist.com/wp-json/wp/v2/posts/121881
Links
66- https://advisor.visualcapitalist.com
- https://decarbonization.visualcapitalist.com
- https://decarbonization.visualcapitalist.com/3-learnings-for-scaling-up-wind-and-solar-power
- https://decarbonization.visualcapitalist.com/about-us
- https://decarbonization.visualcapitalist.com/all-commercially-available-long-duration-energy-storage-technologies-in-one-chart