
demo.themeisle.com/visualizer/bubble-chart
Preview meta tags from the demo.themeisle.com website.
Linked Hostnames
5- 20 links todemo.themeisle.com
- 3 links tothemeisle.com
- 1 link todocs.themeisle.com
- 1 link towww.facebook.com
- 1 link tox.com
Thumbnail
Search Engine Appearance
https://demo.themeisle.com/visualizer/bubble-chart
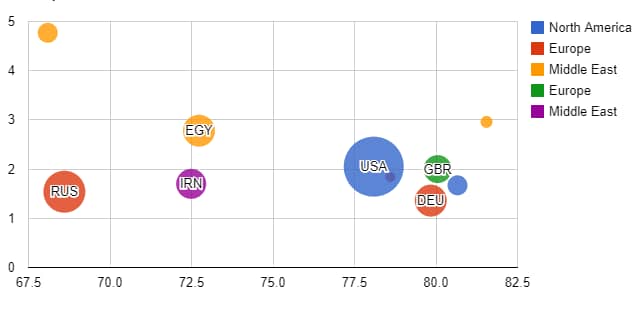
Bubble chart - Visualizer Demo
A bubble chart is a type of chart that displays three dimensions of data. Bubble charts can be considered a variation of the scatter plot, in which the data points are replaced with bubbles. Here’s Read more
Bing
Bubble chart - Visualizer Demo
https://demo.themeisle.com/visualizer/bubble-chart
A bubble chart is a type of chart that displays three dimensions of data. Bubble charts can be considered a variation of the scatter plot, in which the data points are replaced with bubbles. Here’s Read more
DuckDuckGo
https://demo.themeisle.com/visualizer/bubble-chart
Bubble chart - Visualizer Demo
A bubble chart is a type of chart that displays three dimensions of data. Bubble charts can be considered a variation of the scatter plot, in which the data points are replaced with bubbles. Here’s Read more
General Meta Tags
10- titleBubble chart - Visualizer Demo
- charsetUTF-8
- viewportwidth=device-width, initial-scale=1
- robotsmax-image-preview:large
- robotsmax-snippet:-1, max-image-preview:large, max-video-preview:-1
Open Graph Meta Tags
11 og:localeen_US
- og:typearticle
- og:titleBubble chart - Visualizer Demo
- og:descriptionA bubble chart is a type of chart that displays three dimensions of data. Bubble charts can be considered a variation of the scatter plot, in which the data points are replaced with bubbles. Here’s Read more
- og:urlhttps://demo.themeisle.com/visualizer/bubble-chart/
Twitter Meta Tags
4- twitter:cardsummary
- twitter:descriptionA bubble chart is a type of chart that displays three dimensions of data. Bubble charts can be considered a variation of the scatter plot, in which the data points are replaced with bubbles. Here’s Read more
- twitter:titleBubble chart - Visualizer Demo
- twitter:imagehttps://mllj2j8xvfl0.i.optimole.com/w:auto/h:auto/q:mauto/f:best/https://demo.themeisle.com/visualizer/wp-content/uploads/sites/108/2020/02/bubblechart.png
Link Tags
27- EditURIhttps://demo.themeisle.com/visualizer/xmlrpc.php?rsd
- alternatehttps://demo.themeisle.com/visualizer/feed/
- alternatehttps://demo.themeisle.com/visualizer/comments/feed/
- alternatehttps://demo.themeisle.com/visualizer/bubble-chart/feed/
- alternatehttps://demo.themeisle.com/visualizer/wp-json/wp/v2/posts/331
Links
26- http://docs.themeisle.com/category/657-visualizer
- https://demo.themeisle.com/cdn-cgi/l/email-protection#9aa5e9eff8f0fff9eea7d8eff8f8f6ffbfa8aaf9f2fbe8eebcb9aaa9a2a1f8f5fee3a7f2eeeeeae9a0b5b5fefff7f5b4eef2fff7fff3e9f6ffb4f9f5f7b5ecf3e9effbf6f3e0ffe8b5f8eff8f8f6ffb7f9f2fbe8eeb5
- https://demo.themeisle.com/visualizer
- https://demo.themeisle.com/visualizer/area-chart
- https://demo.themeisle.com/visualizer/author/dany-caissygmail-com