www.macrotrends.net/1453/crude-oil-vs-the-s-p-500
Preview meta tags from the www.macrotrends.net website.
Linked Hostnames
1Thumbnail

Search Engine Appearance
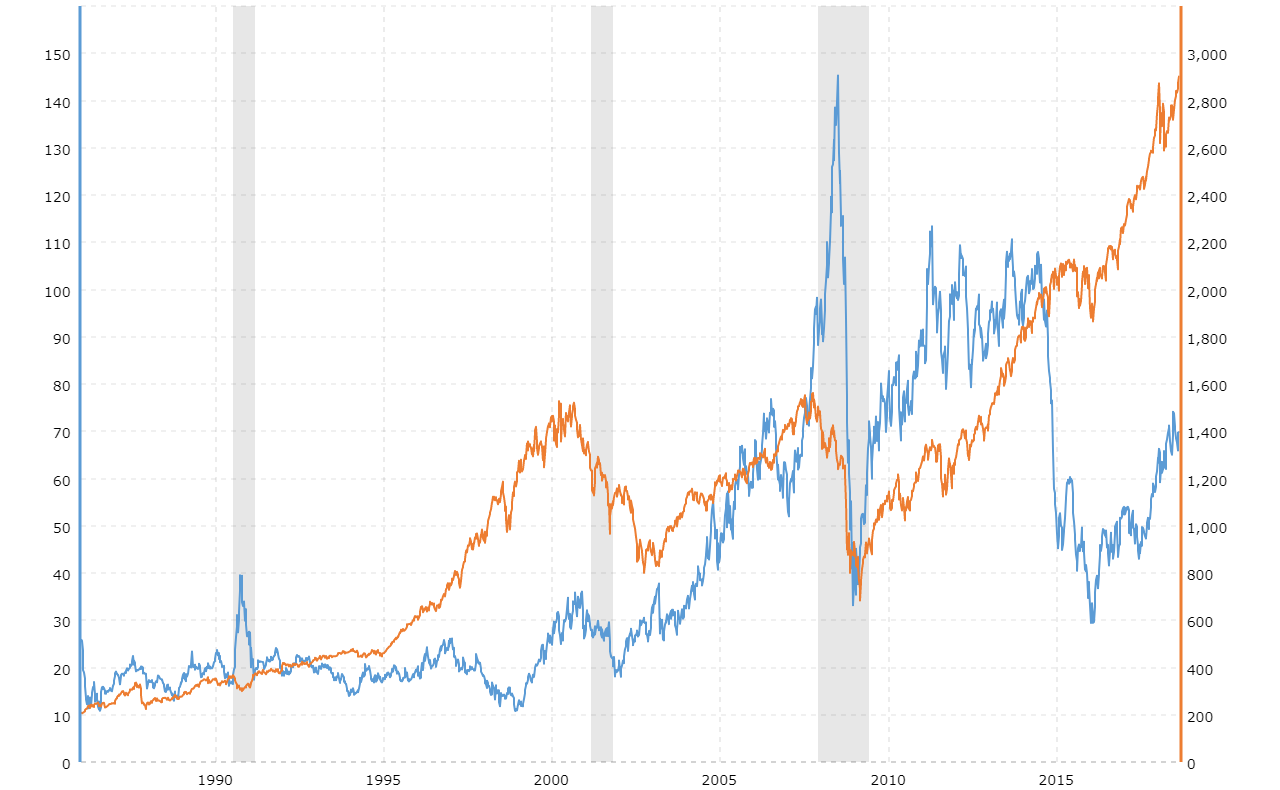
Crude Oil vs the S&P 500
This interactive chart compares the daily price of crude oil versus the level of the S&P 500 over the last 10 years. In 2008, it was the S&P that refused to confirm the final spike in commodity prices whereas in 2016, oil is the asset class that is indicating that global deflationary forces are setting in.
Bing
Crude Oil vs the S&P 500
This interactive chart compares the daily price of crude oil versus the level of the S&P 500 over the last 10 years. In 2008, it was the S&P that refused to confirm the final spike in commodity prices whereas in 2016, oil is the asset class that is indicating that global deflationary forces are setting in.
DuckDuckGo
Crude Oil vs the S&P 500
This interactive chart compares the daily price of crude oil versus the level of the S&P 500 over the last 10 years. In 2008, it was the S&P that refused to confirm the final spike in commodity prices whereas in 2016, oil is the asset class that is indicating that global deflationary forces are setting in.
General Meta Tags
7- titleCrude Oil vs the S&P 500 | MacroTrends
- charsetutf-8
- X-UA-CompatibleIE=edge,chrome=1
- msvalidate.011228954C688F5907894001CD8E5E624B
- google-site-verification6MnD_3iDtAP1ZyoGK1YMyVIVck4r5Ws80I9xD3ue4_A
Open Graph Meta Tags
7- og:urlhttps://www.macrotrends.net/1453/crude-oil-vs-the-s-p-500
- og:titleCrude Oil vs the S&P 500
- og:descriptionThis interactive chart compares the daily price of crude oil versus the level of the S&P 500 over the last 10 years. In 2008, it was the S&P that refused to confirm the final spike in commodity prices whereas in 2016, oil is the asset class that is indicating that global deflationary forces are setting in.
- og:imagehttps://www.macrotrends.net/assets/images/large/crude-oil-vs-the-s-p-500.png
- og:image:typeimage/png
Twitter Meta Tags
5- twitter:cardsummary_large_image
- twitter:site@tmacrotrends
- twitter:titleCrude Oil vs the S&P 500
- twitter:descriptionThis interactive chart compares the daily price of crude oil versus the level of the S&P 500 over the last 10 years. In 2008, it was the S&P that refused to confirm the final spike in commodity prices whereas in 2016, oil is the asset class that is indicating that global deflationary forces are setting in.
- twitter:image:srchttps://www.macrotrends.net/assets/images/large/crude-oil-vs-the-s-p-500.png
Link Tags
12- canonicalhttps://www.macrotrends.net/1453/crude-oil-vs-the-s-p-500
- icon/assets/images/icons/FAVICON/macrotrends-favicon-96.png
- stylesheethttps://fonts.googleapis.com/css?family=Roboto:400,600,700
- stylesheet//maxcdn.bootstrapcdn.com/bootstrap/3.3.7/css/bootstrap.min.css
- stylesheet//maxcdn.bootstrapcdn.com/bootstrap/3.3.7/css/bootstrap-theme.min.css
Emails
1- %69n%66o@%6Dac%72otrends%2En%65t
Links
26- https://www.macrotrends.net
- https://www.macrotrends.net/1369/crude-oil-price-history-chart
- https://www.macrotrends.net/2478/natural-gas-prices-historical-chart
- https://www.macrotrends.net/2479/heating-oil-prices-historical-chart-data
- https://www.macrotrends.net/2480/brent-crude-oil-prices-10-year-daily-chart